Nitrogen emissions to the air in the Baltic Sea area
|
||||
Key message
![]() Annual emissions of nitrogen oxides and annual emissions of ammonia from most of the HELCOM Contracting Parties were lower in 2007 than in 1995.
Annual emissions of nitrogen oxides and annual emissions of ammonia from most of the HELCOM Contracting Parties were lower in 2007 than in 1995.
![]() Annual emissions from the international ship traffic on the Baltic Sea show consistent increasing trends from the year 2000. In many Contracting Parties annual emissions are higher in 2007 than in 2006.
Annual emissions from the international ship traffic on the Baltic Sea show consistent increasing trends from the year 2000. In many Contracting Parties annual emissions are higher in 2007 than in 2006.
Results and Assessment
Relevance of the indicator for describing the developments in the environment
This indicator shows the levels and trends of annual nitrogen oxides and ammonia emissions from anthropogenic sources in HELCOM Contracting Parties into the air. The emissions of nitrogen oxides and ammonia represent the pressure of emission sources on the atmosphere of the Baltic Sea basin and catchment.
Policy relevance and policy reference
The HELCOM Ministerial Declaration of 1988 called for a 50 % reduction in discharges of nutrients to air and water by 1995 with 1987 as a base year. The 1992 Helsinki Convention and the 1998 Ministerial Declaration reaffirmed the need to further reduce discharges; leading to the adoption of several relevant Recommendations concerning measures to reduce emissions from point sources and diffuse sources. In 1990 HELCOM adopted its first Recommendation on Monitoring of Airborne Pollution Load (HELCOM Recommendation 11/1), which was later superseded by the Recommendations 14/1 and 24/1.
On the European level the relevant policy to the control of emissions of nitrogen oxides aned ammonia to the atmosphere is being taken in the framework of UN ECE Convention on Long-Range Transboundary Air Pollution (CLRTAP) and in the EU NEC Directive. The Executive Body of CLRTAP adopted the Protocol to Abate Acidificationon, Eutrophication and Ground Level Ozone in Gothenburg (Sweden) on 30 November 1999. The Protocol sets 2010 emission ceilings for four pollutants: sulphur, NOx, VOCs and ammonia. According to the Gothenburg Protocol, European NOx and ammonia emissions should be reduced by at least 41% and 17%, respectively, compared to their levels in 1990. This Protocol entered into force in on 17 May 2005. The national emission ceilings set by EU NEC Directive in 2001 for SO2, NOx, VOC and ammonia emissions are designed with the aim of meeting the interim environmental objectives.
Assessment
Emissions from outside the Baltic Sea region add to the nitrogen loads entering the Baltic, as do emissions from the ships. In 2007, 12% of nitrogen oxides (NOx) emissions from Baltic Sea shipping traffic were deposited to the sea. Current estimates indicate systematic annual increase of these emissions in the range 2-3%.
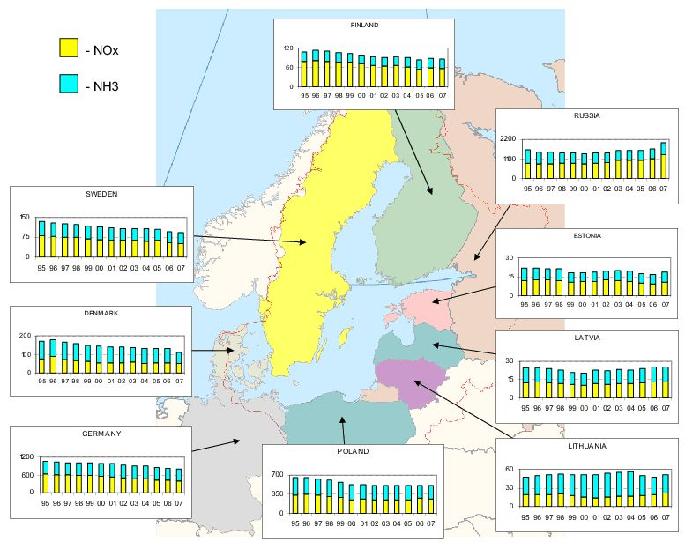
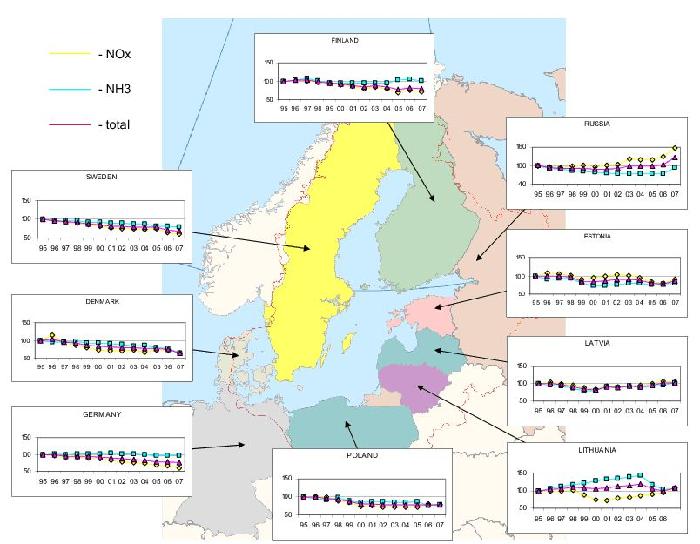
Time series of nitrogen oxides, ammonia and total nitrogen annual emissions in the period 1995 – 2007 are shown, for all HELCOM Contracting Parties, in Figure 1. Time series of nitrogen oxides, ammonia and total nitrogen annual emissions for the same period, in percent of 1995 emissions, are shown in Figure 2.
Figure 1. Map of annual atmospheric emissions of nitrogen oxides, ammonia and total nitrogen from individual HELCOM Contracting Parties in the period 1995 – 2007. Units: ktonnes N/yr. Note: Different scales have been used for the various countries. The data cover emissions from all countries, except for Russia, where only emissions from the area covered by EMEP are included. This area was significantly extended for 2007 resulting in large increase of nitrogen emissions from Russia. Click image to enlarge.
Figure 2. Map of annual atmospheric emissions of nitrogen oxides, ammonia and total nitrogen from individual HELCOM Contracting Parties in the period 1995 – 2007, in percent of 1995 emissions. Note: The data cover emissions from all countries, except for Russia, where only emissions from the area covered by EMEP are included. This area was significantly extended for 2007 resulting in large increase of nitrogen emissions from Russia. Click image to enlarge.
For most of the countries, a decline can be seen in the period 1995 – 2007 . The opposite trend can be noticed for ammonia emissions from Finland and Lithuania and nitrogen oxides emissions from Latvia and especially Russia. A reduction for the emissions from the Baltic Sea region in the years 1995 – 2007 is more significant for nitrogen oxides emissions than for ammonia emissions. However, it should be taken into account that nitrogen oxide emissions from the international ship traffic on the Baltic Sea showed an increasing trend in the considered period and they will also tend to increase after 2007.
In all HELCOM Contracting Parties, except Lithuania, Latvia and Russia, nitrogen oxides emissions were lower in 2007 than in 1995 with the most significant drop of nitrogen oxides emissions in Germany (40%) and Sweden (39%). A reduction, in the considered period, can be also noticed in Denmark (34%), Finland (29%), Poland (21%) and Estonia (10%). Nitrogen oxides emissions in Latvia were 5% and in Lithuania 7% higher in 2007 than in 1995. A significant increse of 2007 nitrogen oxides emissions can be observed in the EMEP part of the Russian Federation, mainly due to large exchange of official EMEP area covering more emissions sources in Russia. Compared to 1995, Russian emissions are 56% higher in 2007.
Ammonia emissions in all HELCOM Contracting Parties, except Finland and Lithuania were lower in 2006 than in 1995, with the largest reduction in Denmark (34%) followed by Poland (23%), Sweden (21), Estonia (20%), Russia (5%) and Germany (3%). Compared to 1995, ammonia emissions in Latvia, Finland and Lithuania are respectively, 7%, 1% and 1% higher in 2007.
For all HELCOM Contracting Parties, except Latvia (3% increase), Lithuania (7% increase), and Russia (27% increase), the reductions of total nitrogen emissions can be observed in the period 1995 – 2007, ranging from 34% in Denmark to 15% in Estonia.
A significant increase of both nitogen oxides and ammonia emissions from the Russian Federation can be observed from the year 2006 to 2007. This increase is mainly caused by the extension of official EMEP domain in the year 2007 and taking into account more nitrogen emissions sources from the additional part of Russia.
Data
Table 1. National total emissions of nitrogen oxides from individual HELCOM Contracting Parties in the period 1995 – 2007. Units: ktonnes N/yr.
| Country | 1995 | 1996 | 1997 | 1998 | 1999 | 2000 | 2001 | 2002 | 2003 | 2004 | 2005 | 2006 | 2007 |
| Denmark | 76.9 | 88.3 | 74.3 | 67.3 | 62.5 | 57.1 | 55.9 | 55.0 | 57.5 | 52.2 | 56.6 | 56.4 | 50.7 |
| Estonia | 11.7 | 12.6 | 12.2 | 11.8 | 10.5 | 11.2 | 11.5 | 12.2 | 11.9 | 11.2 | 9.8 | 9.3 | 10.5 |
| Finland | 78.5 | 81.6 | 78.8 | 76.4 | 75.2 | 71.6 | 66.9 | 63.2 | 66.2 | 62.3 | 54.0 | 58.7 | 55.6 |
| Germany | 648.6 | 624.0 | 601.3 | 590.3 | 583.0 | 564.5 | 536.5 | 509.5 | 488.4 | 473.0 | 439.2 | 424.4 | 390.8 |
| Latvia | 12.4 | 13.0 | 12.4 | 11.8 | 11.1 | 10.5 | 11.5 | 11.2 | 11.6 | 11.8 | 12.5 | 13.3 | 13.0 |
| Lithuania | 19.7 | 19.5 | 19.3 | 19.9 | 17.5 | 14.8 | 14.3 | 15.6 | 16.0 | 16.6 | 17.5 | 18.7 | 21.0 |
| Poland | 341.2 | 351.5 | 339.0 | 301.6 | 290.0 | 255.0 | 258.1 | 242.3 | 246.0 | 244.8 | 246.8 | 270.8 | 269.3 |
| Russia | 782.2 | 754.0 | 737.4 | 773.8 | 784.3 | 747.9 | 785.7 | 821.2 | 945.0 | 941.4 | 941.4 | 1019.6 | 1326.7 |
| Sweden | 82.3 | 79.3 | 76.0 | 73.6 | 70.0 | 66.1 | 64.2 | 62.6 | 61.7 | 60.1 | 62.4 | 53.1 | 50.3 |
| HELCOM CP | 2053.5 | 2023.9 | 1950.8 | 1926.5 | 1904.2 | 1798.7 | 1804.6 | 1792.7 | 1904.3 | 1873.4 | 1840.1 | 1924.2 | 2188.0 |
Table 2. National total emissions of ammonia from individual HELCOM Contracting Parties in the period 1995 – 2007. Units: ktonnes N/yr.
| Country | 1995 | 1996 | 1997 | 1998 | 1999 | 2000 | 2001 | 2002 | 2003 | 2004 | 2005 | 2006 | 2007 |
| Denmark | 93.7 | 90.5 | 90.3 | 91.4 | 87.2 | 86.8 | 86.1 | 83.7 | 80.4 | 80.6 | 76.2 | 73.7 | 61.8 |
| Estonia | 10.0 | 9.1 | 9.2 | 9.2 | 7.9 | 7.3 | 7.4 | 7.5 | 7.9 | 8.0 | 7.6 | 7.7 | 8.0 |
| Finland | 28.7 | 29.9 | 31.0 | 29.2 | 27.3 | 27.2 | 27.3 | 27.4 | 27.3 | 27.4 | 29.8 | 30.0 | 30.0 |
| Germany | 528.8 | 531.4 | 524.2 | 530.0 | 534.9 | 531.9 | 543.1 | 534.7 | 533.9 | 527.6 | 510.1 | 511.3 | 411.5 |
| Latvia | 12.4 | 11.8 | 11.6 | 10.8 | 9.8 | 10.0 | 11.2 | 11.1 | 11.7 | 10.9 | 11.5 | 12.0 | 12.6 |
| Lithuania | 28.1 | 29.7 | 31.4 | 32.7 | 34.2 | 35.8 | 36.8 | 38.0 | 39.0 | 40.1 | 32.5 | 28.8 | 29.9 |
| Poland | 311.3 | 298.9 | 287.4 | 303.9 | 280.0 | 264.4 | 270.5 | 267.7 | 265.6 | 260.6 | 268.9 | 236.1 | 240.5 |
| Russia | 689.3 | 627.5 | 611.9 | 566.6 | 551.8 | 546.0 | 525.4 | 504.8 | 504.8 | 511.4 | 511.4 | 495.8 | 708.3 |
| Sweden | 52.5 | 50.5 | 50.8 | 50.2 | 48.4 | 47.9 | 46.6 | 46.8 | 46.1 | 46.5 | 43.1 | 42.8 | 41.5 |
| HELCOM CP | 1754.8 | 1679.2 | 1647.7 | 1623.9 | 1581.5 | 1557.3 | 1554.4 | 1521.7 | 1516.8 | 1513.1 | 1491.2 | 1438.2 | 1 544.0 |
Table 3. National total emissions of total nitrogen from individual HELCOM Contracting Parties in the period 1995 – 2007. Units: ktonnes N/yr.
| Country | 1995 | 1996 | 1997 | 1998 | 1999 | 2000 | 2001 | 2002 | 2003 | 2004 | 2005 | 2006 | 2007 |
| Denmark | 170.6 | 178.8 | 164.6 | 158.7 | 149.8 | 143.9 | 142.0 | 138.7 | 138.0 | 132.7 | 132.8 | 130.1 | 112.5 |
| Estonia | 21.7 | 21.7 | 21.4 | 21.0 | 18.4 | 18.4 | 18.9 | 19.7 | 19.8 | 19.2 | 17.4 | 17.0 | 18.5 |
| Finland | 107.2 | 111.4 | 109.8 | 105.6 | 102.5 | 98.8 | 94.2 | 90.6 | 93.5 | 89.7 | 83.8 | 88.6 | 85.6 |
| Germany | 1177.4 | 1155.4 | 1125.4 | 1120.3 | 1118.0 | 1096.4 | 1079.6 | 1044.3 | 1022.2 | 1000.6 | 949.3 | 935.6 | 802.2 |
| Latvia | 24.9 | 24.8 | 24.0 | 22.6 | 21.0 | 20.4 | 22.8 | 22.3 | 23.3 | 22.7 | 24.0 | 25.3 | 25.6 |
| Lithuania | 47.7 | 49.2 | 50.7 | 52.6 | 51.6 | 50.6 | 51.1 | 53.6 | 55.0 | 56.8 | 50.0 | 47.5 | 51.0 |
| Poland | 652.5 | 650.5 | 626.5 | 605.5 | 570.0 | 519.4 | 528.5 | 509.9 | 511.6 | 505.4 | 515.7 | 506.9 | 509.7 |
| Russia | 1471.5 | 1381.5 | 1349.3 | 1340.4 | 1336.0 | 1293.9 | 1311.2 | 1326.0 | 1449.8 | 1452.8 | 1452.8 | 1515.4 | 2035.0 |
| Sweden | 134.8 | 129.8 | 126.9 | 123.8 | 118.5 | 114.0 | 110.8 | 109.4 | 107.8 | 106.5 | 105.5 | 95.9 | 91.8 |
| HELCOM CP | 3808.3 | 3703.1 | 3598.6 | 3550.5 | 3485.7 | 3355.9 | 3359.0 | 3314.4 | 3421.0 | 3386.5 | 3331.3 | 3362.4 | 3 732.0 |
Meta data
Technical information
1. Source: EMEP/MSC-W, UMWELTBUNDESAMT – Austria, UN ECE Secretariat.
2. Description of data: Annual total emissions of nitrogen oxides and ammonia were officially reported to the UN ECE Secretariat by the HELCOM Contracting Parties.
3. Geographical coverage: European region.
4. Temporal coverage: Data on nitrogen oxides and ammonia emissions are available for the period 1995 - 2007.
5. Methodology and frequency of data collection: National data on emissions are annually submitted by countries Parties to CLRTAP Convention to the UN ECE Secretariat; the methodology is based on combination of emission measurements and emission estimates based on activity data and emission factors. Submitted data are passing through QA/QC procedure and stored in the UN ECE/EMEP emission database at EMEP/MSC-W.
Quality information
6. Strength and weakness: Strength: data on emissions are annually submitted, checked and stored in the database; Weakness: gaps in time series of national emissions.
7. Uncertainty. No official information about the uncertainty of provided nitrogen emission data have been sent to EMEP from both EMEP and HELCOM Contracting Parties.
8. Further work required: Further work on emission uncertainty is required.
For reference purposes, please cite this indicator fact sheet as follows:
[Author’s name(s)], [Year]. [Indicator Fact Sheet title]. HELCOM Indicator Fact Sheets 2009. Online. [Date Viewed], http://www.helcom.fi/environment2/ifs/en_GB/cover/.
Last updated: 13 November 2009


