Waterborne loads of nitrogens and phosphorus to the Baltic Sea in 2006
|
||||
Key message
In 2006 the total waterborne (riverine, coastal areas, and direct point and diffuse source) load of nitrogen entering the Baltic Sea amounted to 635 700 tons, and total phosphorus load was 28 200 tons. The total runoff in 2006 was 13 600 m3/s.
Results and assessment
Relevance of the indicator for describing developments in the environment
Eutrophication of the Baltic Sea is mainly caused by excessive inputs of nitrogen and phosphorus from the land-based sources. About 75% of the nitrogen and at least 95% of the phosphorus entering the Baltic Sea is waterborne (i.e. via rivers or as direct discharges into the sea). The total catchment area of monitored rivers cover 97% of the total Baltic Sea catchment area.
Policy relevance and policy references
Information on the waterborne inputs, including riverine inputs, of nitrogen and phosphorus is of key importance in order to follow up the long-term changes in the nutrient load into the Baltic Sea. This information, together with information from land-based sources within the catchment, is also crucial for being able to determine the priority order of different sources of nutrients for the pollution of the Baltic Sea as well as for assessing the effect of measures taken to reduce the pollution load. Quantified input data is a prerequisite to interpret and evaluate the state of the marine environment and related changes in the open sea and coastal waters.
Assessment
Riverine nutrient load consists of discharges and losses from different sources within a river's catchment area, including discharges from industry, municipal waste water treatment plants, scattered dwellings, losses from agriculture and managed forests, as well as natural background losses and atmospheric deposition. According to the PLC-4 report, diffuse load (mainly agriculture) contributed almost 60% of waterborne nitrogen inputs and 50% of phosphorus, respectively. As a result of improved treatment of industrial and municipal wastewater treatment plants, the nutrient discharges from point sources have reduced significantly between 1985 and 2000. However, the reduction targets for diffuse sources such as agriculture have not yet been fulfilled.
Both N and P fluxes vary significantly from year to year depending mainly on hydrological conditions. In periods of high runoff, nutrients are abundantly leached from soil, thus increasing the loads originating from diffuse sources and natural leaching. To evaluate the change of pressure on nutrient supply to the Baltic region it is necessary to know the variability of runoff and normalize for this natural variability.
The change in waterborne nitrogen loads figures from 2005 to 2006 show a decrease in input for Estonia, Germany, Latvia, and Lithuania. For the rest of the countries the nitrogen levels were similar to levels of previous years or only slightly higher (note that due to missing Russian data in 2005, it is not possible to determine changes in Russian waterborne nitrogen inputs). These changes in loads correspond well with the changes in flow. Waterborne phosphorus inputs in 2006 were similar to 2005 loads for all other countries except Estonia and Russia, who reported loads of about half of that reported the previous year.
Not all the changes in phosphorus loads can be explained by river runoff. When comparing the 2006 waterborne loades to the 10 year average (1997-2006), waterborne nitrogen input load has decreased by about 5%, and phosphorus by almost 15%. The riverine, coastal and point source flow in 2006 was 11% lower than the 10-year flow average suggesting that a large part of the nitrogen and phosphorus reductions are due to hydrological variations. Total waterborne phosphorus inputs have clearly decreased suggesting positive effects of the implementation of load reduction measures in catchment area. It is known that the load reduction measures are particularly efficient for phosphorus in municipal wastewater treatment plants.
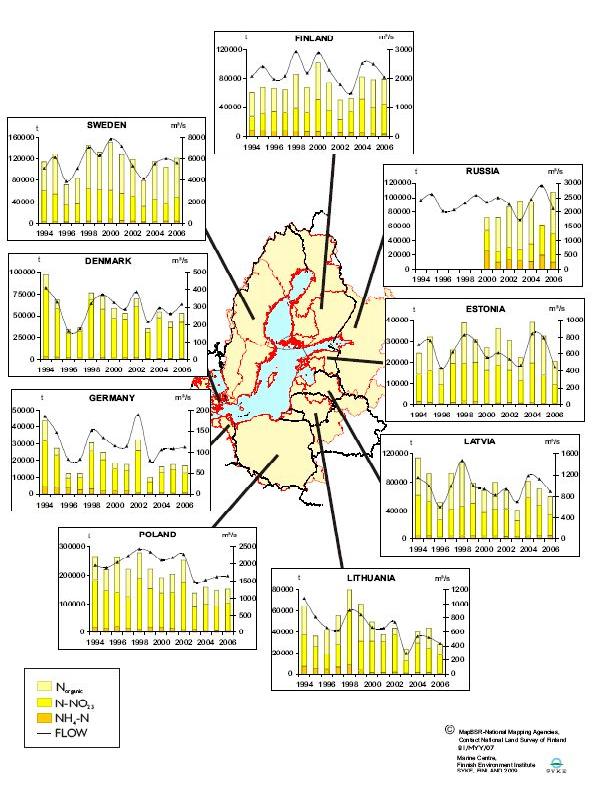
Figure 1. Direct inputs of nitrogen (Ntotal, NH4-N, NO2,3-N) in t/a to the Baltic Sea and the river, coastal and direct point and diffuse source flow in m3/s of 1994-2006 of the 9 countries. (Note variable scales in the graphs and that the Russian Ntotal load for 2005 is missing - see metadata section below for clarification). Click image to enlarge.
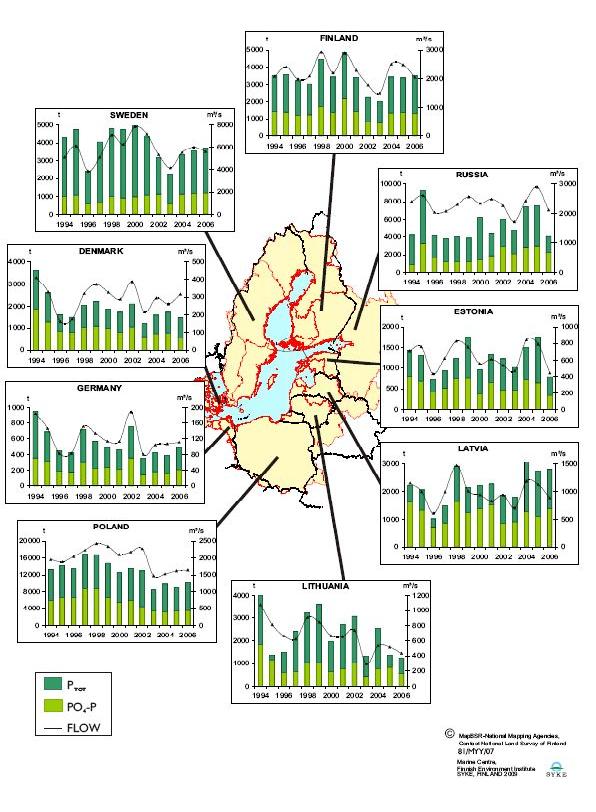
Figure 2. Direct inputs of phosphorus (Ptotal, PO4-P) in t/a to the Baltic Sea and the river, coastal and direct point and diffuse source flow in m3/s of 1994-2006 of the 9 countries. (Note variable scales in the graphs). Click image to enlarge!
Data
Time series of direct inputs to the Baltic Sea of total nitrogen and total phosphorus including the river, coastal and direct point source flow in 1994-2006.
Table 1. Riverine, coastal and point source flow to the Baltic Sea of 9 countries in 1994-2006, m3/s
| COUNTRY | 1994 | 1995 | 1996 | 1997 | 1998 | 1999 | 2000 | 2001 | 2002 | 2003 | 2004 | 2005 | 2006 |
| Denmark | 410.5 | 329.0 | 162.0 | 175.7 | 320.6 | 372.7 | 327.1 | 288.9 | 387.7 | 215.7 | 295.4 | 262.1 | 316.5 |
| Estonia | 710.8 | 761.1 | 431.2 | 622.2 | 827.0 | 756.4 | 558.9 | 611.3 | 536.7 | 466.4 | 841.9 | 793.4 | 441.8 |
| Finland | 2078.4 | 2406.8 | 1982.8 | 2091.3 | 2931.1 | 2198.2 | 2892.9 | 2295.1 | 1784.4 | 1503.7 | 2515.9 | 2489.6 | 2051.6 |
| Germany | 184.8 | 146.6 | 82.3 | 82.7 | 151.3 | 134.2 | 114.6 | 113.7 | 188.7 | 79.7 | 105.0 | 107.5 | 111.7 |
| Latvia | 1149.5 | 998.3 | 605.8 | 991.8 | 1470.4 | 1004.7 | 940.2 | 825.4 | 935.4 | 701.2 | 1184.2 | 1122.9 | 888.0 |
| Lithuania | 1078.7 | 814.4 | 662.9 | 621.2 | 907.2 | 846.5 | 666.0 | 655.4 | 741.4 | 292.1 | 533.1 | 517.0 | 433.1 |
| Poland | 1952.6 | 1884.2 | 2045.5 | 2236.7 | 2431.7 | 2346.3 | 2103.1 | 2182.4 | 2279.1 | 1474.1 | 1529.4 | 1619.7 | 1647.6 |
| Russia | 2411.7 | 2612.3 | 2036.5 | 2077.1 | 2308.6 | 2576.9 | 2347.0 | 2494.4 | 2263.9 | 1729.1 | 2437.4 | 2903.5 | 2120.2 |
| Sweden | 5111.1 | 6125.0 | 3891.8 | 5105.8 | 7075.2 | 6285.8 | 7828.3 | 7179.0 | 5332.2 | 4162.5 | 5527.9 | 6014.5 | 5603.7 |
| Total Baltic | 15088.1 | 16077.6 | 11900.9 | 14004.6 | 18423.0 | 16521.8 | 17778.0 | 16645.5 | 14449.5 | 10624.6 | 14970.2 | 15830.2 | 13614.1 |
Table 2. Riverine, coastal and direct point and diffuse source inputs of Ntotal of 9 countries in 1994-2006 as totals, t/a (Note: Only direct point sources included in the Russian load in 2005)
| COUNTRY | 1994 | 1995 | 1996 | 1997 | 1998 | 1999 | 2000 | 2001 | 2002 | 2003 | 2004 | 2005 | 2006 |
| Denmark | 97540.6 | 68379.6 | 34407.7 | 36274.0 | 76393.9 | 73557.5 | 58926.8 | 52958.3 | 69427.9 | 35174.8 | 54794.4 | 42619.8 | 52747.7 |
| Estonia | 24400.9 | 32185.1 | 16813.1 | 25737.6 | 38787.8 | 30965.3 | 26874.0 | 36192.3 | 30430.1 | 22327.6 | 39037.0 | 32583.3 | 20411.8 |
| Finlandi | 60364.5 | 67605.9 | 65842.0 | 64239.4 | 86406.8 | 67227.6 | 101368.0 | 74573.4 | 51021.8 | 52934.6 | 82288.9 | 78435.3 | 78946.2 |
| Germany | 43556.3 | 27305.2 | 12081.5 | 12173.2 | 30622.9 | 24774.3 | 18620.7 | 17540.5 | 32426.3 | 9967.7 | 16080.6 | 17573.9 | 16880.3 |
| Latvia | 114120.7 | 91708.4 | 51413.3 | 92238.4 | 107471.2 | 78535.0 | 67492.8 | 79609.6 | 68023.5 | 40726.0 | 81329.3 | 70636.1 | 59520.8 |
| Lithuania | 64922.6 | 36041.9 | 41999.2 | 55835.6 | 79901.5 | 66378.6 | 49818.1 | 37334.5 | 43527.8 | 23422.2 | 39927.2 | 43777.3 | 27964.7 |
| Poland | 266068.5 | 220514.8 | 264381.5 | 221599.1 | 278452.7 | 221943.9 | 191737.3 | 204341.4 | 252334.0 | 137028.6 | 157608.0 | 146303.0 | 151684.0 |
| Russia | N/A | N/A | N/A | N/A | N/A | N/A | 72124.6 | 72539.4 | 87465.5 | 95671.0 | 94141.3 | 14351.9* | 107556.3 |
| Sweden | 113957.8 | 129178.8 | 72001.5 | 83519.1 | 145303.0 | 132465.7 | 151029.2 | 127721.1 | 118961.5 | 79354.1 | 114439.4 | 103774.3 | 119980.3 |
| Total Baltic | 784931.9 | 672919.5 | 558939.8 | 591616.4 | 843339.9 | 695847.9 | 737991.5 | 702810.6 | 753618.4 | 496606.6 | 679646.0 | 550054.9 | 635692.0 |
* Russian riverine Ntotal load to the Gulf of Finland in 2005 is missing
Table 3. Riverine, coastal and direct point and diffuse source inputs of Ptotal of 9 countries in 1994-2006 as totals, t/a.
| COUNTRY | 1994 | 1995 | 1996 | 1997 | 1998 | 1999 | 2000 | 2001 | 2002 | 2003 | 2004 | 2005 | 2006 |
| Denmark | 3621.4 | 2588.1 | 1602.7 | 1488.9 | 2039.0 | 2214.0 | 1864.9 | 1715.0 | 2098.0 | 1198.0 | 1578.3 | 1717.7 | 1468.1 |
| Estonia | 1425.9 | 1316.0 | 735.6 | 937.5 | 1240.7 | 1748.1 | 965.0 | 1346.0 | 1237.4 | 1023.4 | 1501.6 | 1763.0 | 785.7 |
| Finland | 3507.5 | 3586.9 | 3194.8 | 3040.4 | 4475.1 | 3437.6 | 4835.4 | 3407.0 | 2239.3 | 2001.5 | 3434.9 | 3382.4 | 3488.2 |
| Germany | 955.4 | 685.9 | 447.2 | 417.9 | 716.9 | 567.9 | 486.4 | 457.9 | 751.7 | 345.6 | 418.4 | 387.9 | 487.1 |
| Latvia | 2205.2 | 2060.5 | 1009.6 | 1471.1 | 2918.7 | 2148.6 | 2207.0 | 2266.6 | 1862.9 | 1797.2 | 3178.2 | 2738.4 | 2796.3 |
| Lithuania | 3985.8 | 1372.7 | 1496.1 | 2418.0 | 3228.1 | 3611.8 | 1950.4 | 2733.7 | 3073.1 | 1324.1 | 2565.3 | 1358.8 | 1241.3 |
| Poland | 13344.9 | 14265.4 | 13461.9 | 16882.8 | 16833.9 | 14740.1 | 12555.4 | 13589.5 | 12957.5 | 8458.4 | 9746.0 | 8910.7 | 10163.6 |
| Russia | 4192.0 | 9263.0 | 4187.7 | 3810.6 | 4048.8 | 3866.0 | 6196.1 | 4376.7 | 5956.8 | 4746.1 | 7429.5 | 7565.3 | 4071.6 |
| Sweden | 4296.9 | 4720.2 | 2438.7 | 4061.2 | 4773.5 | 4734.5 | 4945.3 | 4327.2 | 3154.6 | 2249.5 | 3341.6 | 3552.4 | 3712.4 |
| Total Baltic | 37534.9 | 39858.8 | 28574.3 | 34528.5 | 40274.6 | 37068.8 | 36005.9 | 34219.5 | 33331.2 | 23143.9 | 33193.8 | 31376.5 | 28214.3 |
Meta data
Technical Information:
1) Data have been collected by the Contracting Parties of HELCOM and submitted to the Pollution Load Compilation database (PLC database). The data base is located in the Finnish Environment Institute (SYKE).
2) Description of data:
The data are based on annual average concentrations (mg/l) of nutrients and their fractions (Ptotal-PO4-P, PO4-P, Ntotal, NH4-N, NO2-N, NO3-N and NO2,3-N), concentrations of heavy metals (Cd, Pb and Hg) and mean flows (m³/s). The contracting parties have calculated the annual loads (t/a) of monitored and unmonitored rivers, coastal areas and direct point sources (Wastewater treatment plants, industries and fish farms). From 2003 on also loads on direct diffuse sources have been collected. The data have been pooled together as total loads to the Baltic Sea by country.
Monitored river loads and most of the point source data are based on measurements, and unmonitored river catchment, coastal area loads and direct diffuse loads on estimates, respectively.
The fractions in the nitrogen graph (Figure 1) have been calculated by deducting the reported loads of NH4-N, and NO2-N, NO3-N, or NO2,3-N as a sum, from the reported total nitrogen (Ntotal) load resulting in the fractions of NH4-N, NO2,3-N and organic nitrogen.
Apart from the above, in the table 2 only the reported total nitrogen (Ntotal) has been used not the sum of fractions.
In the phosphorus graph (Figure 2) total phosphorus load have been divided into two fractions Ptot and PO4-P
As for the Ntotal, only the reported total phosporus (Ptotal) load have been used in the table 3.
3) Spatial coverage: drainage of the Baltic Sea of 9 riparian countries; Denmark, Estonia, Finland, Germany, Latvia, Lithuania, Poland, Russia and Sweden, including the drainages of the Baltic Sea in Belarus, Czech Republic, Norway, Slovakia and Ukraine.
4) Transboundary rivers:
For the transboundary rivers, the following loads have been used:
River Tornio (Finland)/Torne älv (Sweden): in the Swedish data
River Narva (Russia and Estonia): in the Estonian data
River Oder (Poland and Germany): in the Polish data
5) Temporal coverage: nutrients 1994-2006 and harmful substances 1994-2006.
6) Russian data includes also the loads of the Kaliningrad Region, if reported.
Data Quality:
1) Methodology and frequency are variable, but the methods used have been agreed on the PLC-5 guidelines. For monitored rivers daily flow and concentration regression or monthly flow and concentrations, and for unmonitored areas loads based on the surface area comparison with a similar monitored area have been used for calculations.
2) Data are heterogeneous in space and time, which may cause some variation between years. Due to robust analysing methods in some countries reported loads might be too high.
Missing data
Only the missing data of all sources, i.e. monitored rivers, coastal area and direct point and diffuse sources, have been listed below. Therefore, more data may be partially missing.
Flow
No data of 1994-1999 from the Kaliningrad region of Russia and no Latvian data of costal areas in 1994-2003
Nitrogen
Most of the data of 1994-2003 from the Kaliningrad region of Russia and Russian data of 1994-1999 and Ntot data of 2005 from the Gulf of Finland.
It should be noted, that due to the missing Russian riverine Ntotal load to the Gulf of Finland in 2005, the difference between the calculated sum of Nitrogen fractions (Figure 1) and the reported Ntotal load (Table 2) is evident. Only the total loads of direct point sources have been included.
Phosphorus
Most of the data of 1994-2006 from the Kaliningrad region of Russia.
Lead
No data of 1994, 1996-1999, 2002-2003 and 2005-2006 from Denmark, no data of 1995-1999 and 2001-2003 from Estonia and no data from Lithuania 2006.
Cadmium
No data of 1994, 1996-1999 and 2005-2006 from Denmark, no data of 1995-1999 and 2001-2003 from Estonia, no data from Russia 2003.
Mercury
No data of 1994, 1996-1999 and 2005-2006 from Denmark, no data of 1995-1999 and 2001-2003 from Estonia, no data of 1994-2000 and 2002-2004 from Latvia, no data from Lithuania of 1994-1997, 2002 and 2006, and no data from Sweden 1994.
Analysis method of Mercury was changed in Finland in 2000.
Missing data have been listed in table 4.
Table 4. Years of the missing data by parameter and country.
| COUNTRY | Flow | Nitrogen | Phosphorus | Lead | Cadmium | Mercury |
| Denmark | 1994, 1996-1999, 2002-2003, 2005-2006 | 1994, 1996-1999, 2005-2006 | 1994, 1996-1999, 2005-2006 | |||
| Estonia | 1995-1999, 2001-2003 | 1995-1999, 2001-2003 | 1995-1999, 2001-2003 | |||
| Finland | ||||||
| Germany | ||||||
| Latvia | BAP, GUR COASTAL AREA 1995-2003 | 1994-2000, 2002-2004 | ||||
| Lithuania | COASTAL AREA 1994-1995 | 2006 | 1994-1997, 2002, 2006 | |||
| Poland | ||||||
| Russia | BAP 1994-1999, COASTAL AREA 1994-2006 | BAP MONITORED (Kaliningrad) 1994-2003, GUF 1994-1999; BAP and GUF COASTAL AREA 1994-2006 | MOST OF THE DATA OF BAP (Kaliningrad Region) | 2003 | ||
| Sweden | 1994 |
For reference purposes, please cite this indicator fact sheet as follows:
[Author’s name(s)], [Year]. [Indicator Fact Sheet title]. HELCOM Indicator Fact Sheets 2008. Online. [Date Viewed], http://www.helcom.fi/environment2/ifs/en_GB/cover/.
Last updated: 30 June 2008


