Total amounts of the artificial radionuclide caesium -137 in Baltic Sea sediments
|
||||
Key message
The most significant source of artificial radioactivity in the Baltic Sea sediments is the fallout from the Chernobyl accident. The distribution pattern of Cs-137, the major radionuclide in the Chernobyl deposition, in the Baltic Sea sediments is scattered due the uneven deposition and the sediment accumulation to the bottoms. The highest amounts occur in the sediments of the Bothnian Sea and the eastern Gulf of Finland. The total inventory of Cs-137 in the Baltic Sea sediments was estimated to be about 2 100 - 2 400 TBq in the beginning of the 2000s. Nonetheless, most of the radioactivity in the sediments of the Baltic Sea originate from naturally occurring radionuclides. At present the radioactivity in the sediments is not expected to cause harmful effects to the Baltic Sea wildlife. The continuous monitoring work and observations of time trends of the radioactive substances are the bases for knowing and understanding the state of the radioactivity in the Baltic Sea.
Results and assessment
The main sources of Cs-137 have been the fallout from the Chernobyl accident in 1986 and the global fallout caused by nyclear weapon tests in the 1950s and 1960s [1]. The total input of Cs-137 activity from Chernobyl to the Baltic Sea was estimated at 4 700 TBq while that from the global fallout was 900 TBq [2]. In the course of time a significant share of caesium has sunk to the bottom and accumulated into the sediments [3,4].
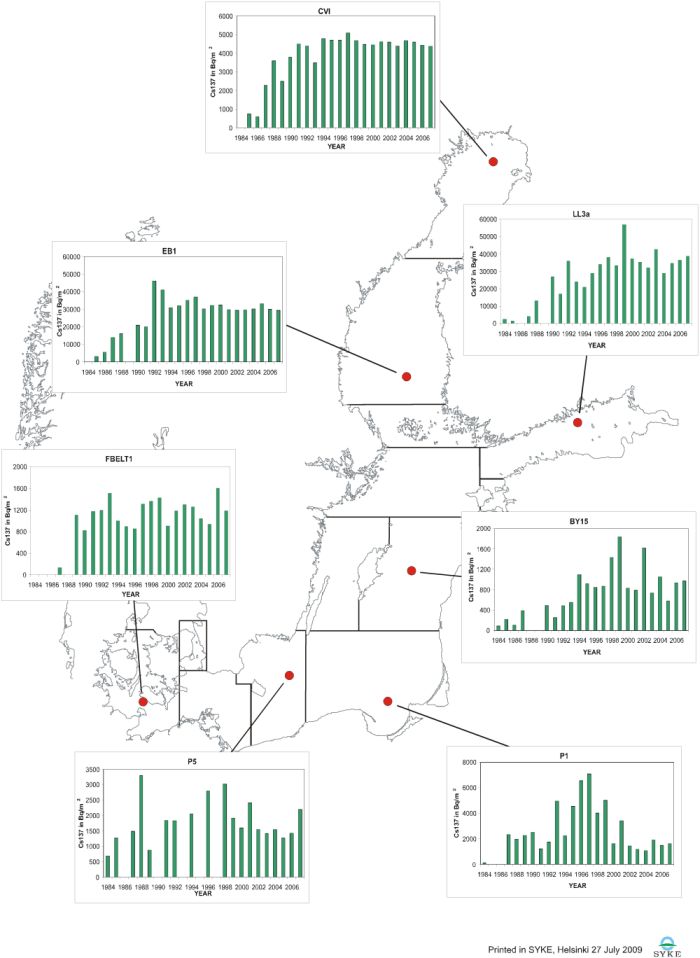
The distribution pattern of Chernobyl-derived Cs-137 in the drainage area and in the sediments of the Baltic Sea was very scattered [1,2,3]. The highest deposition values occured in the areas surrounding the Gulf of Bothnia and the eastern Gulf of Finland and also the highest total amounts of Cs-137 activities (Bq per square metre) are observed in the bottom sediments of these areas (figure 1). In the Baltic Proper, Belt Sea, Kattegat and Sound the amounts are considerably lower than in the northern parts of the Baltic Sea (figure 1). Also, the variability inside the sea areas is large. In addition to uneven deposition, the total amounts have also been affected by the type of the bottom sediments, bottom topographies, sediment accumulation rates in different sea areas, unstable sedimentation processes and river discharges [3,4].
Figure 1. Total amounts of Cs-137 activities (Bq/m2) in the Baltic Sea sediments during 2002-2006 in different sampling stations.
The total inventory of artificial Cs-137 in the seabed of the Baltic Sea was estimated to be about 2 100 - 2 400 TBq in the beginning of the 2000s [3]. The Bothnian Sea, the main accumulation basin for Chernobyl caesium, contains 73% of the total inventory as illustrated in figure 2. Chernobyl-derived caesium has continued to deposit into the seabed, but due to the slower accumulation rate and radioactive decay of Cs-137 (half-life is 30.1 years), the total inventories of this radionuclide have stopped increasing (figure 3). Nowdays the inventory of Cs-137 is 8 - 9 times higher compared to the pre-Chernobyl level indicating that the concentrations of artificial radionuclides are still higher than the target of the HELCOM ecological objective “radioactivity at pre-Chernobyl level”. However, most of the radioactivity in the sediments of the Baltic Sea originate from naturally occurring radionuclides, such as K-40. The inventory of K-40 is estimated to be roughly 8 500 TBq, four times higher than the total inventory of Cs-137 given above [3].
While there are still considerable amounts of artificial radioactivity in the Baltic Sea sediments due to the radionuclides with long half-lives, the radioactivity is not expected to cause harmful effects to the Baltic Sea wildlife.

Figure 2. Distribution of Cs-137, as percent of total inventory in sediment, between different subregions of the Baltic Sea [3].

Figure 3. Total amounts of Cs-137 (Bq m-2) in sediments of different sampling stations in the Baltic Sea. Different scales are used in the graphs.
References
[1] HELCOM, 2009. Radioactivity in the Baltic Sea 1999-2006. Baltic Sea Environment Proceedings No.117, Helsinki Commission, Helsinki.
[2] Ilus E, 2007. The Chernobyl accident and the Baltic Sea. Boreal Env. Res. 12: 1-10.
[3] Ilus E, Mattila J, Nielsen SP, Jakobson E, Herrmann J, Graveris V, Vilimaite-Silobritiene B, Suplinska M, Stepanov A and Lüning M, 2007. Long-lived radionuclides in the seabed of the Baltic Sea. Baltic Sea Environment Proceedings No.110, pp. 1-41. Helsinki Commission, Helsinki.
[4] Mattila J, Kankaanpää H and Ilus E, 2006. Estimation of recent sediment accumulation rates in the Baltic Sea using artificial radionuclides 137Cs and 239,240Pu as time markers. Boreal Env. Res. 11: 95–107.
[5] HELCOM, 2000. Intercomparison of sediment sampling devices using artificial radionuclides in Baltic Sea sediments – The MOSSIE Report. Baltic Sea Environment Proceedings No.80, Helsinki Commission, Helsinki.
[6] Ikäheimonen TK and Vartti VP, 2007. An Intercomparison of Radionuclide Analyses in a Baltic Sea Sediment Sample, in Ilus E (ed). Long-lived radionuclides in the seabed of the Baltic Sea. Baltic Sea Environment Proceedings No.110, pp. 1-41. Helsinki Commission, Helsinki.
Metadata
Description of data
The monitoring programme of HELCOM MORS-PRO includes 49 permanent sampling stations for bottom sediments. This report is based on the regular data reported by all the Contracting Parties to the HELCOM MORS database. The data are given as total amounts of Cs-137 in Bq/m2.
Technical information
The samples were taken with different types of sediment corers tested and compared [5]. The sediment cores were sectioned into slices of 1-5 cm, the slices were freeze-dried and homogenised. The dried samples were analysed by gamma-ray spectrometry.
Quality information
The quality of the analytical data submitted to the MORS database is tested through on-going intercomparison exercises, which show that the quality of data is very good [1, 6].
For reference purposes, please cite this indicator fact sheet as follows:
[Author’s name(s)], [Year]. [Indicator Fact Sheet title]. HELCOM Indicator Fact Sheets 2009. Online. [Date Viewed], http://www.helcom.fi/environment2/ifs/en_GB/cover/.
Last updated: 18 August 2009


