Wave climate in the Baltic Sea 2008
|
||||
Key message
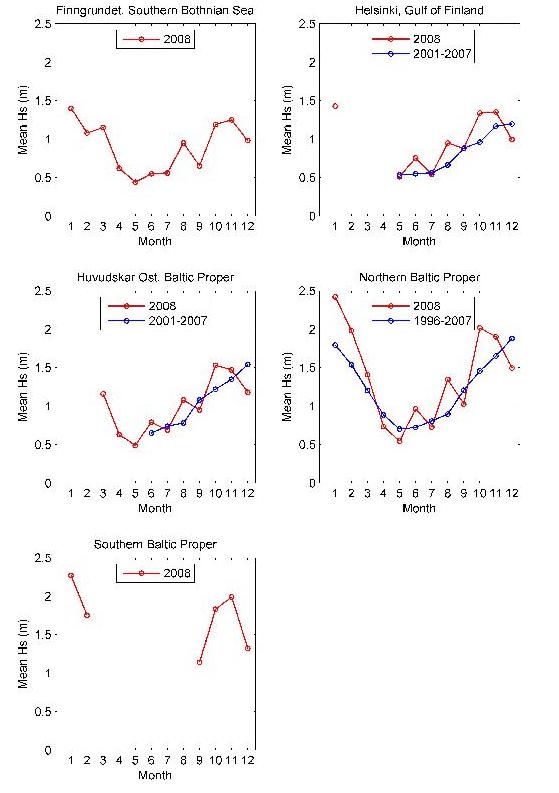
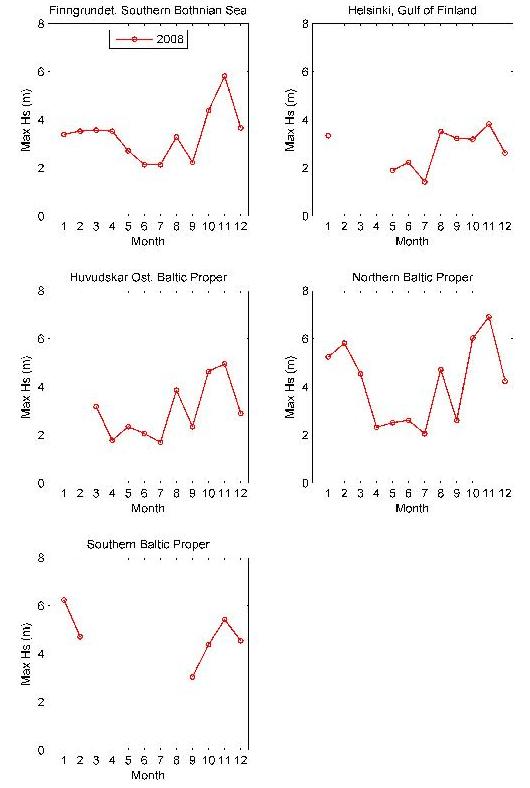
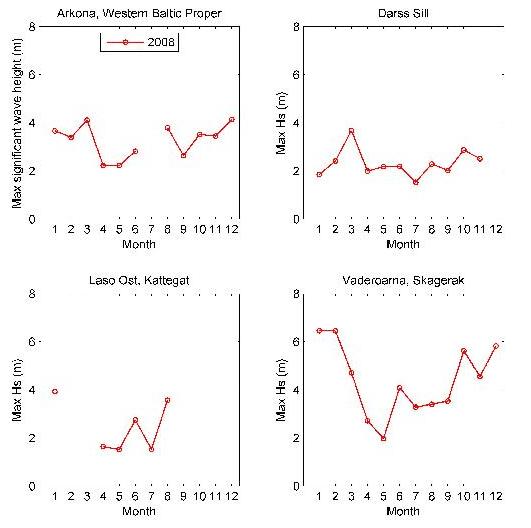
The wave climate in the Baltic Sea 2008 was characterised with rather strong monthly and spatial variation. In average the roughest months were January, February, March, August and November, while April, May and December were calmer. Several monthly records were made in different parts of the Baltic Sea but on the yearly basis the significant wave heights remained under record values. The highest significant wave heights during the deployment periods were 5.8 metres (November) in the Southern Bothnian sea, 3.8 metres (November) in the Gulf of Finland, 6.9 metres (November) in the Northern Baltic Proper, 6.2 metres in the Southern Baltic Proper (January), 4.1 metres in the Western Baltic Proper (March and December), 3.9 m (January) in Kattegat and 6.5 metres (January) in Skagerak.
Results and assessment
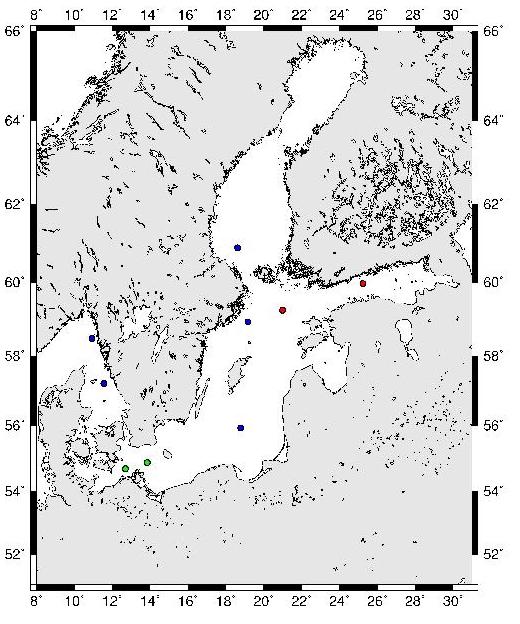
In 2008 waves were measured in nine locations in the Baltic Sea and Skagerak (Figure 1). These buoys provide real time information of the wave climate for professional and free time navigation. The wave measurements are also important for wave related research and wave model development. As waves contribute to the mixing of the surface layer and their influence can extend to the bottom (resuspension) the information about the yearly wave activity adds to the understanding of the physical environment of the Baltic Sea.
The Bothnian Bay
The Southern Bothnian Sea, station Finngrundet
The buoy at Finngrundet was operating the whole year. The highest measured significant wave height in the Southern Bothnian Sea was 5.8 metres (24 November). The significant wave height measured was above 3 metres at several occasions during January until April. The significant wave height was under two metres during the whole time period May until July. Also, the period August until October was rather calm and three metres was only exceeded once in August and twice in October. At 31 October 4.4 metres was observed. The significant wave height exceeded two metres once in July and three metres once in August and three times in September.
The Gulf of Finland
The middle parts of the Gulf of Finland, station Helsinki
In January 2008 the significant wave height exceeded three metres twice, the highest value, 3.4 metres, was measured on 13 January. The buoy was recovered on 31 January for a maintenance break and it was redeployed in the beginning of May. In May, July and September the wave climate was typical for the season: in May the significant wave height remained under two metres and in July under 1.5 metres. In September a significant wave height of 3.2 was measured (9 September).
In June the wave climate was rougher than usual although the significant wave height remained under 2.2 metres. August was clearly rougher than usual and on 5 August a significant wave height of 3.5 metres was measured. This is the highest measured value in August since the measurements started in 2001. Also October and November were clearly rougher than usual. In October the significant wave height was below 0.5 metres only once. The highest significant wave height for the deployment season 2008, 3.8 metres, was measured on 11 November. The measurements continued at this station until 18 December and the first half of December was calm for the season. The significant wave height exceeded 1.5 metres only four times and the highest measured significant wave height was 2.6 metres (3 December).
The Baltic Proper
The Northern Baltic Proper, stations Northern Baltic Proper and Huvudskär Ost
Due to the calm winter the wave measurements at the station Northern Baltic Proper could be carried out through the whole year. In January the significant wave height was never below 0.5 metres and remained 82% of the time over 1.5 metres. The significant wave height was at its highest on 19 January when it reached 5.3 metres. Also February and March were rougher than usually, the highest significant wave heights for the months were 5.8 metres (1 February) and 4.6 metres (26 March).
April and May were calmer than usual. In April the significant wave height exceeded two metres twice being at highest 2.3 metres and in May the significant wave height reached 2.5 metres twice. In June the wave climate was rougher than usual although the significant wave height remained under 2.6 metres. In July the significant wave height remained most of time under one metre, being at highest 2.1 metres (16 July).
August was rougher than usual, and a significant wave height of 4.7 metres was measured on 5 August, which is the highest for August since 1997. The rough August was followed by a calm September and the significant wave height did not exceed 2.6 metres. October and November were clearly rougher than usual and the 82 % time the significant wave height remained over 1.0 metre. In October the highest significant wave height was 6.0 metres (5 October) and the highest significant wave height for the deployment season 2008, 6.9 metres, was measured on 18 November. December was calmer than usual, the significant wave height exceeded four metres once, on 3 December (4.2 metres).
The buoy at Huvudskär, to SWW from the buoy at station Northern Baltic Proper and closer the shoreline, was deployed late in February and was the operating until the middle of December. The monthly mean significant wave heights followed the values from the station Northern Baltic Proper but the magnitude was smaller due to the more sheltered location. Also at this station the highest significant wave height in the measurement period was measured during the storm on 18 November: 5.0 metres. Three metres was exceeded once in February, once in March, twice in August, three times in October and November, respectively. Especially the spring and summer period, April until July, was very calm, where two metres was exceeded only at three occasions.
Southern Baltic Proper, station Southern Baltic
A buoy was deployed from January until late in February in the Southern Baltic Proper. The buoy was redeployed early in September again. The significant wave height exceeded six metres two times during the measurement season. The record was from 5 January, when 6.2 metres was measured. January was windy and three metres was exceeded at several occasions. On 25 January, 6.0 metres was measured and at one storm event in February, the significant wave height reached 4.7 metres. September was very calm, but during October until December, the significant wave height exceeded four metres several times. On 18 November, 5.4 metres was measured.
Western Baltic Proper, stations Darss Sill and Arkona
In 2008 the buoy off Cape Arkona was out of service for a longer period in July, and the buoy at Darss Sill in December. Therefore, it has been impossible to determine mean values and maxima for these months.
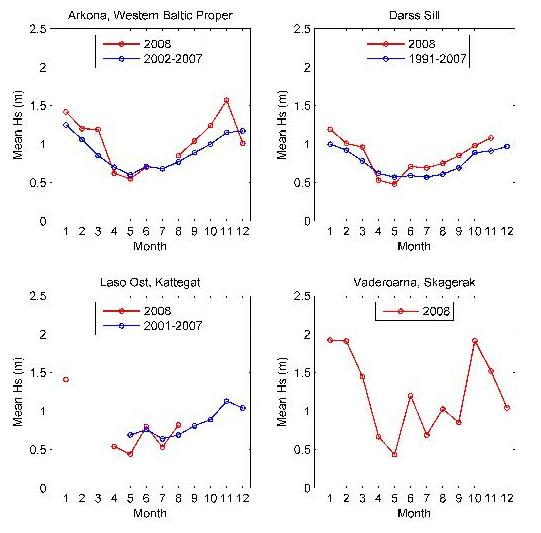
Mean significant wave heights in the area of Darss Sill typically are 0.6 m in summer and 0.9 m in winter. At the Arkona station, mean significant wave heights are slightly higher, ranging between 0.6 m and 1.2 m. This measuring station is farther from the coast and is located in deeper water.
Throughout the year 2008 mean significant wave heights at both measuring stations were about 0.1 m above the long-term means, except for April and May. This is a similar result as in the previous year. In March and November, however, mean significant wave heights at the Arkona station exceeded the mean values by 0.4, respectively 0.5 m, which was due to frequent periods with strong wind. In March four heavy storms occurred, which caused wave heights above 3 m. November was characterized by long-lasting stormy wind and rough sea state, significant wave heights frequently were above 2.5 m, but exceeded 3 m only temporarily. In the area of Darss Sill the significant wave heights generally are lower and storm events are less weighty in the monthly means. In the Western Baltic Proper the predominant direction of strong and stormy wind is in the range SW to W, so that the fetch up to the Darss Sill is essentially shorter than to the Arkona area.
The highest significant wave heights were recorded in the area of Cape Arkona in March and December, in each case 4.1 m. These values were slightly higher than the extremes of the preceding years. In August a westerly storm caused maximum significant wave heights of 3.8 m, which was the highest value measured up to now at Arkona station in this month. Overall the monthly maxima were below the extreme values of the preceding years, particularly in the area of Darss Sill. However, in the latter area, the strongest of the storms in March caused a significant wave height of 3.7 m, this is now the maximum significant wave height for this month since 1991.
Kattegat and Skagerak
Kattegat, station Läsö Ost
The buoy at Läsö Ost was operating from January until early in February and from April until August. The highest significant wave height of 3.9 metres was measured on 31 January. During the period, April until July, the significant wave height barely exceeded two metres at two occasions, which is calmer than usual. Thou, during a storm in August, the highest significant wave height was 3.6 metres.
Skagerak, station Väderöarna
The highest recorded significant wave height, 6.5 metres, was measured at two occasions, on 25 and 31 January, at Väderöarna, in the Northern parts of Skagerak. The highest recording at this station since the measurements started in 2005 is 7.4 metres (14 January 2007). The winter period, January until March, was very windy and the significant wave height exceeded four metres at several occasions. The mean significant wave height for January and February was 1.9 metres. April and May was rather calm, and two metres was only exceeded once. Thou, during several storm events in June until August, three metres was exceeded several times. September was rather calm. In October until December it was very windy and four metres was exceeded at eight individual occasions.
Data
Metadata
In 2008 Finnish Institute of Marine Research (FIMR) made real time wave measurements at two locations in the Baltic Sea, in the Northern Baltic Proper (station Northern Baltic Proper, 59° 15' N, 21° 00' E) and in the Gulf of Finland (station Helsinki, 59° 58' N, 25° 14' E). Due to the reorganisation of the marine research in Finland, the wave related research and activities were moved 1.1.2009 to Finnish Meteorological Institute (FMI).
The Swedish Meteorological and Hydrological Institute (SMHI) made wave measurements at five locations, in the Southern Bothnian Sea (station Finngrundet, 60° 54' N, 18° 37' E), in the Northern Baltic Proper (station Huvudskär Ost, 58° 56' N, 19° 10' E), in the Southern Baltic Proper (station Southern Baltic, 55° 55' N, 18° 47' E), in Kattegat (station Läsö Ost, 57° 13' N, 11° 34' E) and in Skagerak (station Väderöarna, 58° 29' N, 10° 56' E).
Since 1991, wave measurements in the Western Baltic Proper have been carried out in the Darss Sill area at 54° 41.9‘ N, 12° 42.0‘ E (by GKSS Research Centre), and since 2002 also in the area north-west of Cape Arkona at 54° 52.9‘ N, 13° 51.5‘ E (by Bundesamt für Seeschifffahrt und Hydrographie, BSH). Long-term wave climatology for the latter position is not yet available. The measurement series at the Darss Sill station only had to be interrupted once due to ice coverage in the winter of 1995/96.
The waves at each station are measured with surface following buoys, Seawatch, Directional Waveriders and Waveriders. Measurements were collected app. every hour via HF link, Argos-satellite or Orbcomm system. The significant wave height is calculated onboard the buoys over 1600 s time series of surface displacement and the quality of the measurements were checked according to the routines at each of the responsible Institutes.
The lengths of the deployment periods in 2008 are indicated in the text. The length of the period at each station depends on the extent of the ice cover, maintenance and deployment logistics and possible instrument damages. As a consequence, measurements are not always available for 12 months per year for the long-term statistics. The years given in the Figures 7 and 8 indicate the start of the measurements: in some months the statistics are over less years but only statistics over at least three years are plotted in the Figures. Due to the variation of the length of the timeseries in statistics they should be used with caution.
[1] Due to the reorganisation of marine research in Finland the wave related research and activities of Finnish Institute of Marine Research (FIMR) were moved to Finnish Meteorological Institute 1.1.2009.
For reference purposes, please cite this indicator fact sheet as follows:
[Author’s name(s)], [Year]. [Indicator Fact Sheet title]. HELCOM Indicator Fact Sheets 2009. Online. [Date Viewed], http://www.helcom.fi/environment2/ifs/en_GB/cover/.
Last updated: 28 September 2009

