Water Exchange between the Baltic Sea and the North Sea, and conditions in the Deep Basins
|
||||
Key message
The inflow activity of recent years from the Kattegat into the Baltic Sea was coined by a quite unusual sequence of events: a warm summer inflow 2002 was followed by a cold gale-forced one in January 2003, and again by a warm summer inflow 2003, all together they terminated the stagnation period in the Baltic deep water which lasted since 1995. The period afterwards was characterized by low inflow activities with only a slight intensification since 2006. Except in the southern Baltic, the stagnation period lasting since 2004/2005 is strengthening further. A baroclinic inflow in summer 2006, followed by small barotropic inflows in 2007 caused again very high temperatures observed in the central Baltic deepwater. Decreasing inflow activity in 2008 caused in 2009 a deterioration of the previously fair oxygen conditions in the Bornholm Basin.
Results and assessment
Deep water renewal processes can be divided into two types. The “classical” barotropic Major Baltic Inflows (MBIs) and the “new” baroclinic inflows (Matthäus et al. 2008). MBIs occurring in winter and spring are causing higher salinities, low temperatures and increased oxygen levels in the deep basins, while those of either type in summer and autumn increase salinity along their pathway with high temperatures, but carry only low amounts of oxygen.
Before about 1980, MBIs were relatively frequent and could be observed on average once a year (Matthäus et al. 2008). In the last two decades, however, they became rather scarce; the last three major inflows took place in 1993, 1997 and 2003, and a minor one in 2001.
In 2003, the very contrasting thermal signatures of both inflow types provided (and still provide in remote basins) natural ‘tracers’ and allowed a clear insight into the dynamics of deep water propagation through the main basins of the western and central Baltic (Fig. 1).
In the largest Baltic basin, the Eastern Gotland Basin (EGB), the barotropic inflows in autumn 1997 and October 2001 increased the temperature at about 200 m depth to more than 6.5°C but did not improve the oxygen conditions significantly.
In addition, the exceptional baroclinic inflow in summer/autumn 2002 brought very warm water into this basin. Thereafter, it was immediately replaced by a very cold and dense MBI in January 2003, enhanced by some smaller events in spring. Temperature dropped down to around 4.5°C. Thereafter, near-bottom temperatures have exceeded the long-term mean again as a consequence of the baroclinic inflow of 2003, and were rising even further in 2007 due to the baroclinic inflows of 2006 (Nausch et al. 2007, 2008, Fig. 1). In particular, the baroclinic inflow of August/September 2006 carried very warm water into the Bornholm Deep, residing there from November 2006 onward. Apparently it was lifted over the Slupsk Sill in January 2007 and reached the Gotland Basin in April 2007, when extremely high values of 7.1°C were measured there in the near-bottom layer. Despite its drastic temperature signal (Fig. 1), this was a rather smooth substitution process without significant signals in salinity. This event further continued the “warm period” of the central Baltic deepwater lasting since 1997 and faded away during 2008, without new thermal input signals in those levels:
| Deep | July | July | July | July | July | July/Aug | Mean |
| 2003 | 2004 | 2005 | 2006 | 2007 | 2008 | 1971-90 | |
| Bornholm D. | 3.71 °C | 5.12 °C | 6.97 °C | 7.96 °C | 8.80 °C | 7.22 °C | 6.12 °C |
| Gotland D. | 4.63 °C | 6.51 °C | 5.97 °C | 5.95 °C | 6.82 °C | 6.40 °C | 5.62 °C |
| Farö D. | 6.00 °C | 5.87 °C | 6.03 °C | 6.19 °C | 6.06 °C | 6.16 °C | 5.20 °C |
| Landsort D. | 5.88 °C | 5.69 °C | 5.82 °C | 5.78 °C | 5.73 °C | 5.81 °C | 4.76 °C |
| Karlsö D. | 4.90 °C | 5.29 °C | 5.34 °C | 5.23 °C | 5.14 °C | 5.32 °C | 4.18 °C |
The major Baltic inflow from January 2003 was the last strong inflow event into the Baltic Sea. The deep basins were additionally influenced by a warm summer inflow in 2003. The salinity development in the Gotland Basin reflects these inflow processes (Fig. 2). In the deep water, steep increases after inflows are followed by slow decreases in the stagnation periods afterwards. It was particularly the short inflow of August 2003 which elevated the salinity again to levels typical for the 1960s and 1970s. The surface salinity is following this trend delayed by a decade. The effects of these events are phasing out, a new stagnation period had started already in 2004 and continued until 2008 in all deep basins of the central Baltic Sea. The barotropic inflow events of 2007 could influence the deep waters around Gotland only marginally, if at all:
| Deep | July | July | July | July/Aug |
| 2005 | 2006 | 2007 | 2008 | |
| Gotland Deep | 12.73 psu | 12.62 psu | 12.89 psu | 12.66 psu |
| Farö Deep | 12.22 psu | 12.11 psu | 12.15 psu | 12.13 psu |
| Landsort Deep | 11.14 psu | 11.06 psu | 11.23 psu | 11.07 psu |
| Karlsö Deep | 10.35 psu | 10.25 psu | 10.41 psu | 10.27 psu |
Changes of the near-bottom distributions of dissolved oxygen resp. hydrogen sulphide reflect these processes and are displayed for the years 2005 – 2008 in Fig. 3. In spring 2003, the MBI of January had ventilated the Bornholm, Gdansk and Eastern Gotland Basin with considerable amounts of oxygen. In the latter basin an oxygen content of 3.96 ml/l could be measured in the near-bottom layer. Since then a deterioration of the oxygen situation in the deep water was observed. Hydrogen sulphide concentrations (expressed as negative oxygen equivalents) in the near-bottom layer increased continuously:
| Deep | May | July | July | July/Aug |
| 2006 | 2006 | 2007 | 2008 | |
| Gotland Deep | −3.61 ml/l | −4.42 ml/l | −3.95 ml/l | −4.93 ml/l |
| Farö Deep | −2.33 ml/l | −2.56 ml/l | −2.84 ml/l | −3.84 ml/l |
| Landsort Deep | +0.50 ml/l | −1.01 ml/l | −1.08 ml/l | −1.18 ml/l |
| Karlsö Deep | −0.86 ml/l | −1.88 ml/l | −2.74 ml/l | −1.76 ml/l |
Also the vertical extension of the layer containing hydrogen sulphide increased. In summer 2008, in the Gotland and Farö Deeps H2S was found between 125 m and the bottom. At the Landsort Deep station the layer between 100 m and the bottom was anoxic.
In the Bornholm Basin, in contrast, the baroclinic inflows of 2006 and the small barotropic ones of 2007 resulted in an oxygenation of the deep water in both years. Still in May 2009 no hydrogen sulphide was found in the Bornholm Basin, however, the oxygen levels decreased to below 2 ml/l at most stations.
A surprising finding was the complete ventilation of the formerly increasingly anoxic water column at the Karlsö Deep in April 2008 when small concentrations of oxygen (0.5 ml/l) and nitrate (1 µmol/l) were measured near the bottom. This did not repeat in May 2009, rather, the oxygen concentrations in the entire western Gotland Basin dropped below 2 ml/l.
References
Feistel R., Nausch G., Hagen E., 2003, The Baltic Inflow of Autumn 2001, Meereswiss. Ber. Warnemünde, 54, 55-68. http://www.io-warnemuende.de/documents/mebe54_inflow01.pdf
Feistel R., Nausch G., Matthäus W., Hagen E., 2003, Temporal and Spatial Evolution of the Baltic Deep Water Renewal in Spring 2003, Oceanologia 45, 623-642. http://www.iopan.gda.pl/oceanologia/454feis2.pdf
Feistel R., Nausch G., Mohrholz V., Łysiak-Pastuszak E., Seifert T., Matthäus W., Krüger S., Sehested Hansen I., 2003, Warm Waters of Summer 2002 in the Deep Baltic, Oceanologia 45, 571-592. http://www.iopan.gda.pl/oceanologia/454feis1.pdf
Feistel R., Nausch G., Matthäus W., Łysiak-Pastuszak E., Seifert T., Sehested Hansen I., Mohrholz V., Krüger S., Buch E., Hagen E., 2004, Background Data to the Exceptionally Warm Inflow into the Baltic Sea in Late Summer of 2002, Meereswiss. Ber. Warnemünde, 58, 1-58. http://www.io-warnemuende.de/documents/mebe58_2004_paper.pdf
Feistel R., Nausch G., Heene T., Piechura J., Hagen E., 2004, Evidence for a Warm Water Inflow into the Baltic Proper in Summer 2003, Oceanologia 46, 581-598. http://www.iopan.gda.pl/oceanologia/464feist.pdf
Feistel R., Nausch G., Hagen E., 2006, Unusual Baltic Inflow Activity in 2002-2003 and varying Deep-Water Properties, Oceanologia 48(S), 21-35. http://www.iopan.gda.pl/oceanologia/48_S.html#A2
Feistel, R., Feistel, S., Nausch, G., Szaron, J., Łysiak-Pastuszak, E., Ærtebjerg, G., 2008, BALTIC: Monthly time series 1900 – 2005. In Feistel, R., Nausch, G., Wasmund, N. (Eds.), State and Evolution of the Baltic Sea, 1952 – 2005. A Detailed 50-Year Survey of Meteorology and Climate, Physics, Chemistry, Biology, and Marine Environment. John Wiley & Sons, Inc., Hoboken, 311-336.
Matthäus, W., Nehring, D., Feistel, R., Nausch, G., Mohrholz, V., Lass, H.U., 2008, The inflow of highly saline water into the Baltic Sea. In Feistel, R., Nausch, G., Wasmund, N. (Eds.), State and Evolution of the Baltic Sea, 1952 – 2005. A Detailed 50-Year Survey of Meteorology and Climate, Physics, Chemistry, Biology, and Marine Environment. John Wiley & Sons, Inc., Hoboken, 265-309.
Meier, H.E.M., Feistel, R., Piechura, J., Arneborg, L., Burchard, H., Fiekas, V., Golenko, N., Kuzmina, N., Mohrholz, V.,Christian Nohr, Paka, V. T., Sellschopp, J., Stips, A., Zhurbas, V., 2006, Ventilation of the Baltic Sea deep water: A brief review of present knowledge from observations and models. Oceanologia 48(S), 2006, 133-164. http://www.iopan.gda.pl/oceanologia/48_S.html#A8
Nausch, G., Feistel, R., Lass, H.-U., Nagel, K., Siegel, H., 2007, Hydrographisch-chemische Zustandseinschätzung der Ostsee 2006. Meereswissenschaftliche Berichte Warnemünde 70, 2-91. http://www.io-warnemuende.de/documents/mebe70_2006-zustand-hc.pdf
Nausch, G., Feistel, R., Umlauf, L., Nagel, K., Siegel, H., 2008, Hydrographisch-chemische Zustandseinschätzung der Ostsee 2007. Meereswissenschaftliche Berichte Warnemünde 72, 1-93.
Additional information
Cruise reports, oxygen deficiency maps:
http://www.io-warnemuende.de/research/en_datbild.html
MARNET Darss Sill records:
http://www.io-warnemuende.de/projects/monitoring/en_home.html
BSH MARNET:
http://www.bsh.de/Meeresdaten/Beobachtungen/MARNET-Messnetz/index.jsp
Marine Science reports:
http://www.io-warnemuende.de/research/mebe.html
BALTIC atlas:
http://www.io-warnemuende.de/projects/baltic/index.html
Acknowledgments
The German part of Baltic Monitoring Programme (COMBINE) and stations of the German Marine Monitoring Network (MARNET) in the Baltic Sea (Darss Sill mast, Arkona Basin buoy) are conducted by IOW on behalf of the Bundesamt für Seeschifffahrt and Hydrographie (BSH), financed by the German Bundesministerium für Verkehr (BMV). The authors thank Jan Szaron, Oceanographic Laboratory of SMHI, Gothenburg, for providing us with hydrographic-hydrochemical observations from the Swedish Ocean Archive SHARK, obtained within the framework of the Swedish monitoring programme.
Summary (<20 words)
No important inflow events occurred since 2003. Thus, the stagnation period lasting since 2004/2005 is intensified. Some recent baroclinic inflows in 2006 and barotropic inflows in 2007 changed the deep water temperatures and improved the oxygen situation in the southern Baltic slightly, but not in the deeps around Gotland.
Figures
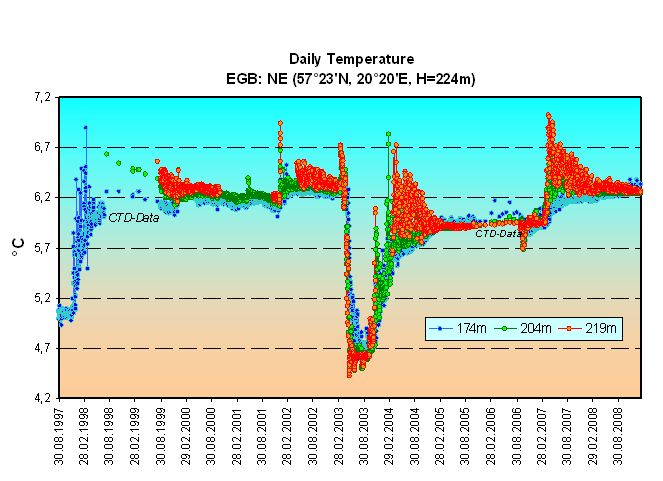
Fig. 1. Temperature series August 1997- February 2009 of the EGB mooring near the Gotland Deep at 174, 204 and 219 m depth. The bathymetric depth at the anchor position is H = 224 m. The temperature signals caused by the latest warm and cold inflow events appear as sudden leaps with subsequently fading fluctuations over typically one year relaxation time.
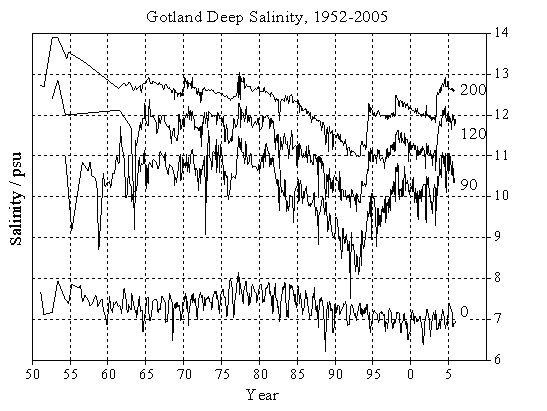
Fig. 2. Salinity in the Gotland Deep at the surface, at 90 m, 120 m and 200 m depth from 1952 to 2005. Monthly mean time series available from the BALTIC atlas (Feistel et al. 2008).
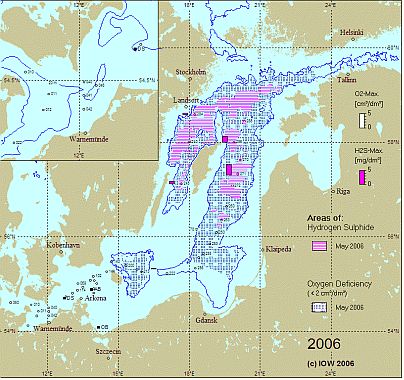
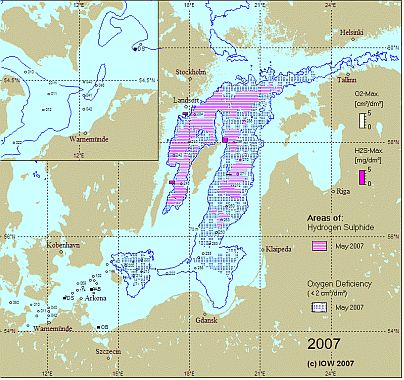
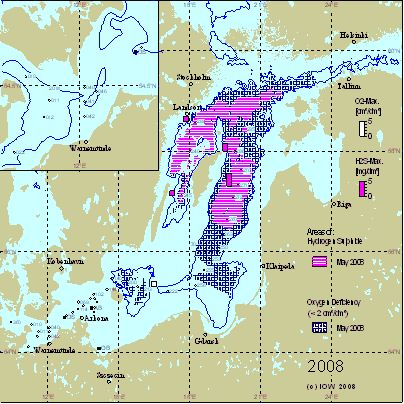
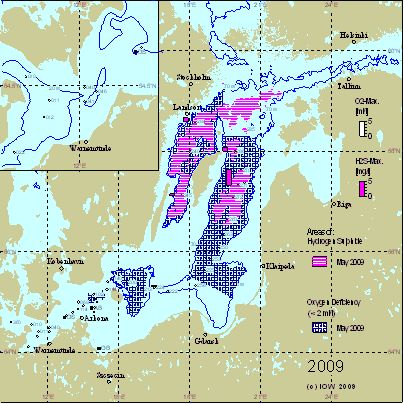
Fig. 3. Areas with oxygen deficiency and hydrogen sulphide in the near bottom layer of the Baltic Sea in May in the years 2006 – 2009. Histograms show the maximum oxygen and hydrogen sulphide concentrations of this layer. The figure contains additionally the 70 m isobath. The top-left corner magnifies the western Baltic Sea with the 20 m isobath.
For reference purposes, please cite this indicator fact sheet as follows:
[Author’s name(s)], [Year]. [Indicator Fact Sheet title]. HELCOM Indicator Fact Sheets 2009. Online. [Date Viewed], http://www.helcom.fi/environment2/ifs/en_GB/cover/.
Last updated: 16 September 2009
