Mercury concentrations in fish muscle

|
||||
Key message
The results concerning the development of mercury concentration in the investigated matrices are not consistent. The concentration in herring from the northern Baltic Proper seems to increase during the investigated time period but with a decreasing trend the recent ten years. The annual mean concentrations in herring muscle during the investigated time period are all below 100 ng/g except for a few years at Ängskärsklubb.

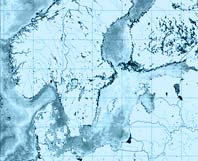
Figure 1. Spatial variation in mean concentration (ng/g fresh weight) of mercury in herring muscle (2005-2008). The highest concentration (around 83 ng/g ) was found in the southern part of the Bothnian Sea (Ängskärsklubb), the lowest (around 5.7 ng/g) in the gulf of Finland. Swedish data are from 2005-2006, Finnish data are from 2005-2007, Estonian data from 2005 and Polish data from 2008. Data obtained from ICES database. Results and assessments
Relevance of the indicator for describing developments in the environment
Analyses of contaminants in biotic samples, in contrast to abiotic matrices, exhibit the bioavaliable part of the contaminants. Herring are commonly used for human consumption.
Policy relevance and policy references
The North Sea Conference (1984, 1987, 1990) that covers all routes of pollution to the North Sea, states that the mercury discharges are to be reduced by 70% between 1985 and 1995, using 1985 as a base year.
The Minister Declaration from 1988, within HELCOM, calls for a reduction of the discharges of mercury to air and water by 50% by 1995 with 1987 as a base year.
The use of mercury in the paper pulp industries has been banned in Sweden since 1966.
According to a governmental proposition (1993/94:163) the aim is that all mercury usage should have ceased the year 2000 in Sweden.
Assessment
There is no common general trend for mercury in herring muscle for the investigated time series. The time series from Landsort show an increasing trend of about 1.6% per year for the whole time period (not significant), but during the last ten years the levels have been decreasing.
Mercury was monitored in spring caught herring from Ängskärsklubb and Karlskrona for four years in the beginning of the seventies, and these series were taken up again in 1996. Both series show lower concentrations during the recent time period compared to the concentrations in the early seventies, at Ängskärsklubb this decrease is about 45%.
The time series for autumn caught herring from Ängskärsklubb in the Bothnian Sea shows a very large between-year variation. Although the sampling site at Ängskärsklubb is located rather far off the coast, the mercury concentration in our herring samples could be influenced by local discharges. Ängskärsklubb may thus not be representative of the Bothnian Sea.

Figure 2. Temporal trends of Hg concentration (ng/g fresh weight) in herring muscle from four different sampling sites (1980-2006). Harufjärden (Bothnian Bay), Ängskärsklubb (S. Bothnian Sea), Landsort (N. Baltic Proper), Utlängan (S. Baltic Proper).

Figure 3. Temporal trends of Hg concentration (ng/g fresh weight) in spring caught herring muscle from southern Bothnian Sea (Ängskärsklubb) and the southern part of Baltic Proper (Karlskrona).
References
Bignert, A., Nyberg E., Asplund L., Eriksson U., Wilander A. Haglund P. 2007. Comments Concerning the National Swedish Contaminant Monitoring Programme in Marine Biota. Report to the Swedish Environmental Protection Agency, 2007. 128 pp.
Data
Table 1. Estimated geometric mean concentrations of mercury (ng/g fresh weight) for the last sampled year during the investigated time period. The trend is reported, if p<0.1. The age intervals for fish are also presented together with the total number of analyses and the number of years of the various time-series.

Metadata
Technical information
Data source: The National Swedish Monitoring Program of Contaminants in Biota
Sampling, sample preparation, storage in specimen bank and evaluation of results are carried out by the Department of Contaminant Research at the Swedish Museum of Natural History, Stockholm. Chemical Analysis is carried out at the Centre for Environmental Monitoring at the University of Agriculture.
Geographical coverage: see data table and map.
Temporal coverage: see data table and figures.
Methodology and frequency of data collection, see Bignert et al, 2007
Methodology of data manipulation. For a detailed description of statistical methods use, see Bignert et al. 2007.
Quality information
The number of years required to detect an annual change of 5% varied between 13 and 19 (25 for Ängskärsklubb) years for the herring time series.
For reference purposes, please cite this indicator fact sheet as follows:
[Author’s name(s)], [Year]. [Indicator Fact Sheet title]. HELCOM Indicator Fact Sheets 2009. Online. [Date Viewed], http://www.helcom.fi/environment2/ifs/en_GB/cover/.
Last updated: 2 October 2009

